Dapper Dapper 感觉最早是 Google 的追踪系统。实际系统的链路会非常长,从上游发起一个搜索,到下游运行,下游可能又是个分布式请求。如果最终结果是上游出现满请求/问题,需要能够找到对应的选项。本身请求的监控是有用的,通过监控,开发者能够知道每个阶段大概的耗时。但对于偶现的查询,可能无法找到对应的耗时来源,需要具体的请求-阶段耗时。
这里还有个问题,就是定位到的结果也要分锅什么的,慢只是一个结果。可能某个系统多租户没做好,然后来个傻逼用户打一堆 AP 请求过来,把别的地方的请求搞慢了。这些地方也要根据 tracing 之类的来分锅。
竟然要分锅,这里暗含了几件事:
这个系统对性能的影响,应该要在预期之内,不能太大
可能可以全打,或者精细的按照一些配置来输出
可能可以 hack 进一些基本的工具,包括 rpc、runtime 等(作者说不需要手工编码的部分,强调了对应用的透明,但我感觉为了一些细粒度的排查,还是需要的吧)
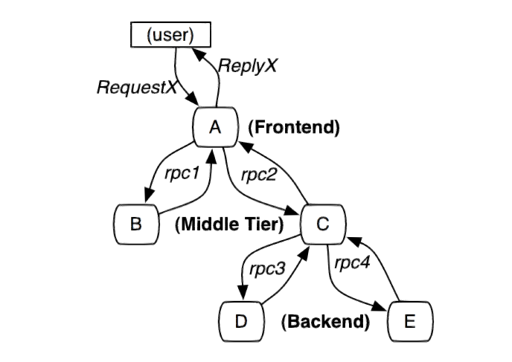
数据模型 一个调用的链路如下文所示:
基本的思路是,这里需要有一些 context (大概可以用类似 snowflake 之类的方式生成):
跟踪标识符(message identifiers)
时间戳(timestamped events)。
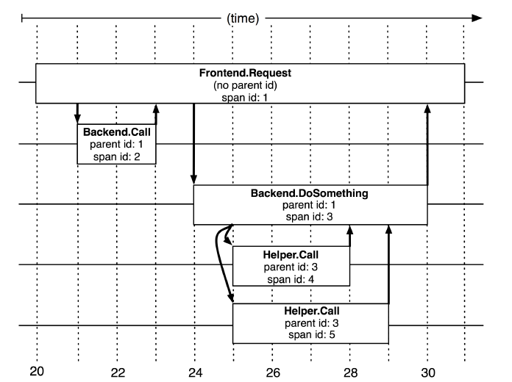
这里是单个的跟踪关系,dapper 这里非常有意思,考虑了层次的/并发的跟踪关系:
如上,这里其实是有一个(多个) Span 对象的,Root 本身构建了一个 Span 对象,然后调用下层的时候也会起 Span。这里可以有一个很显著的事实:Span 是可以跨机器的。
还有个很奇怪的问题是时间戳的偏移,这里本身靠请求发出的时间 > 请求收到的时间保证。(TODO:不过感觉这个是个特别工程的问题了,可以看看这些系统是具体怎么实现的了)。
Dapper 在使用的时候,可能会被丢到 Thread Local Storage 系统里,或者和某个 Context 对象绑定,具体而言:
这个 context 开销尽量小,然后可能可以丢到 TLS 或者某个 context 参数里
在异步调用、起别的线程的时候,能够正确处理它们的所有权
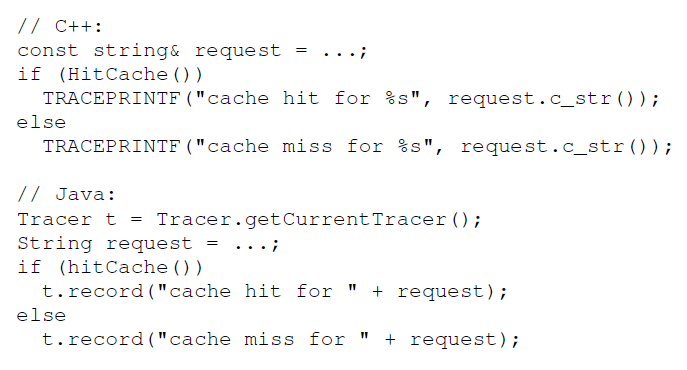
这个时候还要注意到一点,这些大公司可能用的是一套 RPC,RPC 可能又会定义一些 runtime 之类的,trace 得很好的和他们做到一起。这里还可以加入一些 annotation,注入一些标记:
这个我感觉就依赖一些奇怪的内存申请了。论文里还提到可以存 key-value, counter,不过我觉得就是一个多模/语义的问题了。
数据收集
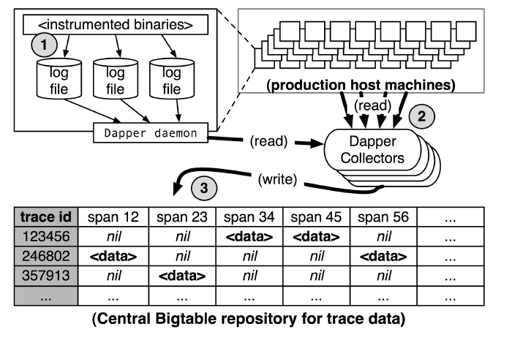
这里分为三个阶段:
log 到本地文件
Dapper 的 deamon 把它弄到某个 collector 里面
最后写到 BigTable 里面,对 模型为 trace_id/span/span_cnt
同时,这里 latency 从 15s - 2min,不算很延迟敏感。这里还有一些重要数据要走 OOB,我个人感觉这里暗示了有一些 tracing 可以是「重要的」。
上图也表明,tracing 大概包括:
客户端和对应的 Dapper daemon
Collectors
一个时序的库,用来存储这样的数据
Tracing 的开销和应对 毕竟要在线上系统跑,肯定要考虑性能问题,考虑 Root Span 需要分配 unique id ,论文描述:
根span的创建和销毁需要损耗平均204纳秒的时间,而同样的操作在其他span上需要消耗176纳秒
如果一个span没有被采样的话,那么这个额外的span下创建annotation的成本几乎可以忽略不计,他由在Dapper运行期对ThreadLocal查找操作构成,这平均只消耗9纳秒。如果这个span被计入采样的话,会用一个用字符串进行标注—在图4中有展现—平均需要消耗40纳秒。这些数据都是在2.2GHz的x86服务器上采集的。
在Dapper运行期写入到本地磁盘是最昂贵的操作,但是他们的可见损耗大大减少,因为写入日志文件和操作相对于被跟踪的应用系统来说都是异步的。
Dapper 将自己的进程设置为 Linux 调度最低的优先级,然后在实践中,占用资源一般非常非常低。
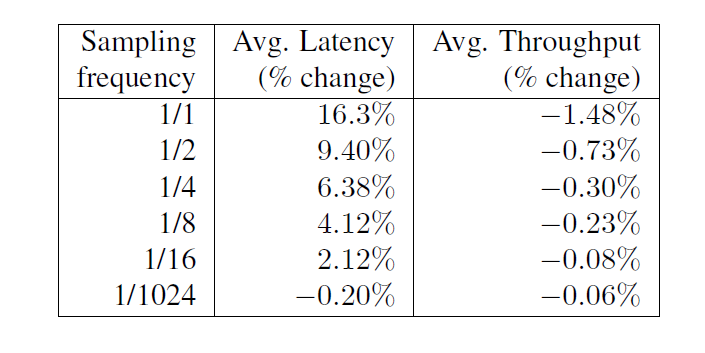
同时,采样率对性能会产生影响,内容如下:
Dapper 能够可变的、自适应的、aggressive 的采样。上层还支持了一些二级采样,继续 discard 一些数据。
百度大搜的一些方案 如果你真的查过一些问题,你就会知道,Dapper 很好,但是很多东西你会希望更多的日志、更高的自由度、必要的时候有一些定制的信息,这里可以参考百度大搜的方案:
https://mp.weixin.qq.com/s/BMbdk5RviLG1Ftlo-qRsDQ https://mp.weixin.qq.com/s/IHVUnyhJr4fhiopMLOJqjA
这个方案相对来说可能和开放方案不是 100% 对齐。里面对数据的可追踪性做了考量,我认为,有意思的地方在于:
希望开启根据某些特征采样的时候,一定能开启
支持全量的采样
我觉得这两点还是比较重要的
采样的一些讨论 上述 baidu 的系统通过一些资源开销完成了完全的采样. 关于 Dapper 本身的采样,可以看 <Uncertainty in Aggregate Estimates from Sampled Distributed Traces>,Google 在这篇论文对采样和概率做了量化描述。
Trace: 工业界实践 工业界有着不少的实践,或许最值得瞅一眼的入门是 Opentracing。有的体系过于庞大,我们会一步一步介绍这个系统是怎么构建的。
brpc tracing: 客户端实现的一个简单例子 介绍这玩意一方面是它是 Dapper 描述的客户端的一个很好的实现,另一方面我上班用的是 brpc… 出于私心瞅一眼。
入口可以看到 Collector 和 Span:
1 2 3 4 5 6 7 8 9 10 11 12 13 14 15 16 17 18 19 20 21 22 23 24 25 26 27 28 29 30 31 32 33 34 35 36 37 38 39 40 41 42 43 44 45 46 47 48 49 50 51 52 53 54 55 56 57 58 59 60 61 62 class Span : public bvar::Collected {friend class SpanDB ; struct Forbidden {}; public : Span (Forbidden) {} ~Span () {} private : uint64_t _trace_id; uint64_t _span_id; uint64_t _parent_span_id; uint64_t _log_id; bthread_id_t _base_cid; bthread_id_t _ending_cid; butil::EndPoint _remote_side; SpanType _type; bool _async; ProtocolType _protocol; int _error_code; std::string _info; Span* _local_parent; Span* _next_client; Span* _tls_next; };
我们首先关注一下这个类型的成员.
Channel::CallMethod 里面,描述了作为 client 发送请求的对应 Span 和行为,调用了 Span::CreateClientSpan。
这里接收一个请求的时候,会初始化它(以 HTTP Server 为例):
1
2
3
4
5
6
7
8
9
10
11
12
13
14
15
16
17
18
19
20
21
22
23
24
25
26
27
28
29
30
31
32
33
34
Span* span = NULL ; const std::string& path = req_header.uri ().path ();const std::string* trace_id_str = req_header.GetHeader ("x-bd-trace-id" );if (IsTraceable (trace_id_str)) { uint64_t trace_id = 0 ; if (trace_id_str) { trace_id = strtoull (trace_id_str->c_str (), NULL , 10 ); } uint64_t span_id = 0 ; const std::string* span_id_str = req_header.GetHeader ("x-bd-span-id" ); if (span_id_str) { span_id = strtoull (span_id_str->c_str (), NULL , 10 ); } uint64_t parent_span_id = 0 ; const std::string* parent_span_id_str = req_header.GetHeader ("x-bd-parent-span-id" ); if (parent_span_id_str) { parent_span_id = strtoull (parent_span_id_str->c_str (), NULL , 10 ); } span = Span::CreateServerSpan ( path, trace_id, span_id, parent_span_id, msg->base_real_us ()); accessor.set_span (span); span->set_log_id (cntl->log_id ()); span->set_remote_side (user_addr); span->set_received_us (msg->received_us ()); span->set_start_parse_us (start_parse_us); span->set_protocol (is_http2 ? PROTOCOL_H2 : PROTOCOL_HTTP); span->set_request_size (imsg_guard->parsed_length ()); }
可以看到,这个地方,如果没有给 trace_id , log_id 的话,这两个会是 0,那我们细看一下对应的逻辑:
1
2
3
4
5
6
7
8
9
10
11
12
13
14
15
16
17
18
19
20
21
22
23
24
25
26
27
28
29
30
31
32
33
34
35
36
37
Span* Span::CreateServerSpan ( const std::string& full_method_name, uint64_t trace_id, uint64_t span_id, uint64_t parent_span_id, int64_t base_real_us) Span* span = butil::get_object <Span>(Forbidden ()); if (__builtin_expect(span == NULL , 0 )) { return NULL ; } span->_trace_id = (trace_id ? trace_id : GenerateTraceId ()); span->_span_id = (span_id ? span_id : GenerateSpanId ()); span->_parent_span_id = parent_span_id; span->_log_id = 0 ; span->_base_cid = INVALID_BTHREAD_ID; span->_ending_cid = INVALID_BTHREAD_ID; span->_type = SPAN_TYPE_SERVER; span->_async = false ; span->_protocol = PROTOCOL_UNKNOWN; span->_error_code = 0 ; span->_request_size = 0 ; span->_response_size = 0 ; span->_base_real_us = base_real_us; span->_received_real_us = 0 ; span->_start_parse_real_us = 0 ; span->_start_callback_real_us = 0 ; span->_start_send_real_us = 0 ; span->_sent_real_us = 0 ; span->_next_client = NULL ; span->_tls_next = NULL ; span->_full_method_name = (!full_method_name.empty () ? full_method_name : unknown_span_name ()); span->_info.clear (); span->_local_parent = NULL ; return span; }
这里有生成 Span 的逻辑,同时注意到,这个逻辑绑定在了 Runtime 的 bthread 上:
1
2
3
4
5
6
7
8
9
10
void EndAsParent () if (this == (Span*)bthread::tls_bls.rpcz_parent_span) { bthread::tls_bls.rpcz_parent_span = NULL ; } } void AsParent () bthread::tls_bls.rpcz_parent_span = this ; }
这里,它把 trace 上下文挂在了 thread local 的地方。那怎么创建子 Span 呢?内容如下:
1
2
3
4
5
6
7
if (parent) { span->_trace_id = parent->trace_id (); span->_parent_span_id = parent->span_id (); span->_local_parent = parent; span->_next_client = parent->_next_client; parent->_next_client = span; }
这里挂了一个 Span 的单链表。
那 Annotation 呢?其实很简单:
1
2
3
4
5
6
void Span::Annotate (const char * fmt, va_list args) const int64_t anno_time = butil::cpuwide_time_us () + _base_real_us; butil::string_appendf (&_info, BRPC_SPAN_INFO_SEP "%lld " , (long long )anno_time); butil::string_vappendf (&_info, fmt, args); }
这里会更新格式,然后丢到 _info 对象里。
我们再看看它是怎么异步析构的:
1
2
3
4
5
6
7
8
9
10
11
12
void Span::destroy () EndAsParent (); Span* p = _next_client; while (p) { Span* p_next = p->_next_client; p->_info.clear (); butil::return_object (p); p = p_next; } _info.clear (); butil::return_object (this ); }
ok,此外,这里可能会造一个 LevelDB 对象,然后有一个 Collector 定期把这些数据收集到 LevelDB.
那采样的逻辑呢?看看这里:
1 2 3 4 5 6 7 8 inline bool IsTraceable (bool is_upstream_traced) extern bvar::CollectorSpeedLimit g_span_sl; return is_upstream_traced || (FLAGS_enable_rpcz && bvar::is_collectable (&g_span_sl)); }
这里通过 CollectorSpeedLimit 这个限流器,完成了「低访问不采样,高访问采样」这样的逻辑。
tokio tracing Tokio Tracing 的文档见:https://tracing.rs/tracing/ . 其实它处理的也是一个 runtime 的问题。因为
The span in which a thread is currently executing is referred to as that thread’s current span.
同时它也处理了一些 field tag 什么的,原论文里面说自己能处理 kv pair 写到 BigTable 什么的,我觉得这里差不多。
tracing-core 实现了一些基础的语义,包括 Span 元信息 MetaData,和 event (记录消息,开 Span 退出 Span 在 tokio-tracing 里面都叫做 event),大致内容如下:
1
2
3
4
5
6
7
8
9
10
11
12
13
14
15
16
17
18
19
20
21
22
23
24
25
26
27
28
29
30
31
32
33
34
#[derive(Debug)] pub struct Event <'a > { fields: &'a field::ValueSet<'a >, metadata: &'static Metadata<'static >, parent: Parent, } #[derive(Clone, Debug, PartialEq, Eq, Hash)] pub struct Id (NonZeroU64);#[derive(Debug)] pub struct Current { inner: CurrentInner, } #[derive(Debug)] enum CurrentInner { Current { id: Id, metadata: &'static Metadata<'static >, }, None , Unknown, } #[derive(Debug)] pub (crate ) enum Parent { Root, Current, Explicit (Id), }
上面是需要的元数据,包括 Parent,Current . 还有一部分重要内容是 Dispatch,文档可见: https://tracing.rs/tracing_core/struct.dispatch
Every thread in a program using tracing has a default collector . When events occur, or spans are created, they are dispatched to the thread’s current collector.
dispatch 内容如下:
1 2 3 4 5 6 7 8 9 10 11 12 13 14 15 16 17 18 19 20 21 22 23 24 #[derive(Clone)] pub struct Dispatch { #[cfg(feature = "alloc" )] collector: Kind<Arc<dyn Collect + Send + Sync >>, #[cfg(not(feature = "alloc" ))] collector: &'static (dyn Collect + Send + Sync ), } #[cfg(feature = "alloc" )] #[derive(Clone)] enum Kind <T> { Global (&'static (dyn Collect + Send + Sync )), Scoped (T), } #[cfg(feature = "std" )] thread_local! { static CURRENT_STATE: State = State { default: RefCell::new (Dispatch::none ()), can_enter: Cell::new (true ), }; }
这部分有个 thread_local 的 State 内容,表示本线程对应的 tracing 上下文。
下面我们看看 Span 具体是怎么实现的,这部分在 tracing 中:
1 2 3 4 5 6 7 8 9 10 11 12 13 14 15 16 17 18 19 20 21 22 23 24 25 26 27 28 29 30 31 32 33 34 35 #[derive(Clone)] pub struct Span { inner: Option <Inner>, meta: Option <&'static Metadata<'static >>, } #[derive(Debug)] pub (crate ) struct Inner { id: Id, collector: Dispatch, }
这里用 DefaultGuard 等内容,很 RAII 的做了一下它们生命周期的变化
让我们来看看 Span 的 Enter 和 Exit
1
2
3
4
5
6
7
8
9
10
11
12
13
14
15
16
17
18
19
20
21
22
23
24
25
#[inline] fn do_enter (&self ) { if let Some (inner) = self .inner.as_ref () { inner.collector.enter (&inner.id); } if_log_enabled! { crate::Level::TRACE, { if let Some (_meta) = self .meta { self .log (ACTIVITY_LOG_TARGET, log::Level::Trace, format_args! ("-> {}" , _meta.name ())); } }} } #[inline] fn do_exit (&self ) { if let Some (inner) = self .inner.as_ref () { inner.collector.exit (&inner.id); } if_log_enabled! { crate::Level::TRACE, { if let Some (_meta) = self .meta { self .log (ACTIVITY_LOG_TARGET, log::Level::Trace, format_args! ("<- {}" , _meta.name ())); } }} }
看,这里调用了 tracing-core 的内容。OK,那最后一个问题,这里都是 thread-local,那么 tokio 呢?这里可以看 span 的 enter 注释,instrument 和 Span::in_scope
minitrace https://github.com/tikv/minitrace-rust
这个项目不力图完善,而是力图快,用 tsc 寄存器等方式大幅度优化了 trace 的性能。比较值得再提的是 ministant: https://github.com/tikv/minstant
Jaeger & OpenTelemetry(OpenTracing) OpenTracing 通过提供了 API 标准,基本上算是做了很不错的事情:https://github.com/opentracing/specification/blob/master/specification.md
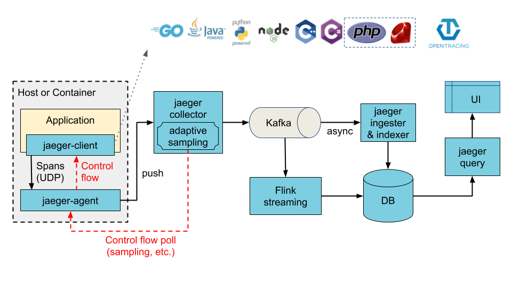
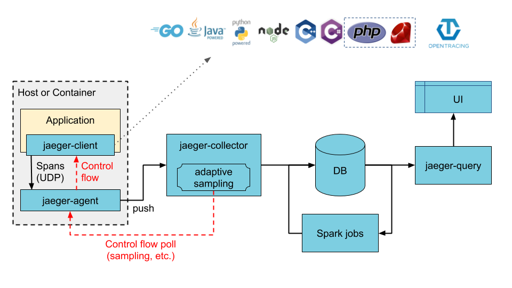
Jaeger 提供了下面 的架构(使用 Kakfa or Direct-to-storage):
这里的 DB 可能还需要一些时序/多模之类的需求: 本质上这个和存储日志差不多,半结构化的数据、最近的数据需要高效查询 etc…
参考 [1] https://bigbully.github.io/Dapper-translation/
[2] https://mp.weixin.qq.com/s/BMbdk5RviLG1Ftlo-qRsDQ
[3] https://mp.weixin.qq.com/s/IHVUnyhJr4fhiopMLOJqjA
[4] https://zhuanlan.zhihu.com/p/34318538
[5] https://www.jaegertracing.io/docs/1.31/architecture/
[6] https://tracing.rs/tracing/
[7] Dapper, a Large-Scale Distributed Systems Tracing Infrastructure